Guide entry section:
Image:

Guide Entry Text:
The chances are, you have feelings about PowerPoint.
You've probably seen it abused with boring presentations that have 15 bullet points per slide, tiny font and no visuals. PowerPoint has become a widely used and often-loathed tool for presentations.
Today, I will ask you to put your feelings aside. PowerPoint (or Keynote) is simply a platform and as we'll see, it can be used for a lot more than quarterly budget reviews. Our focus here is animation and PowerPoint has everything we need for turning your idea into an ExplainerGIF.
The examples below were all created with PowerPoint animations
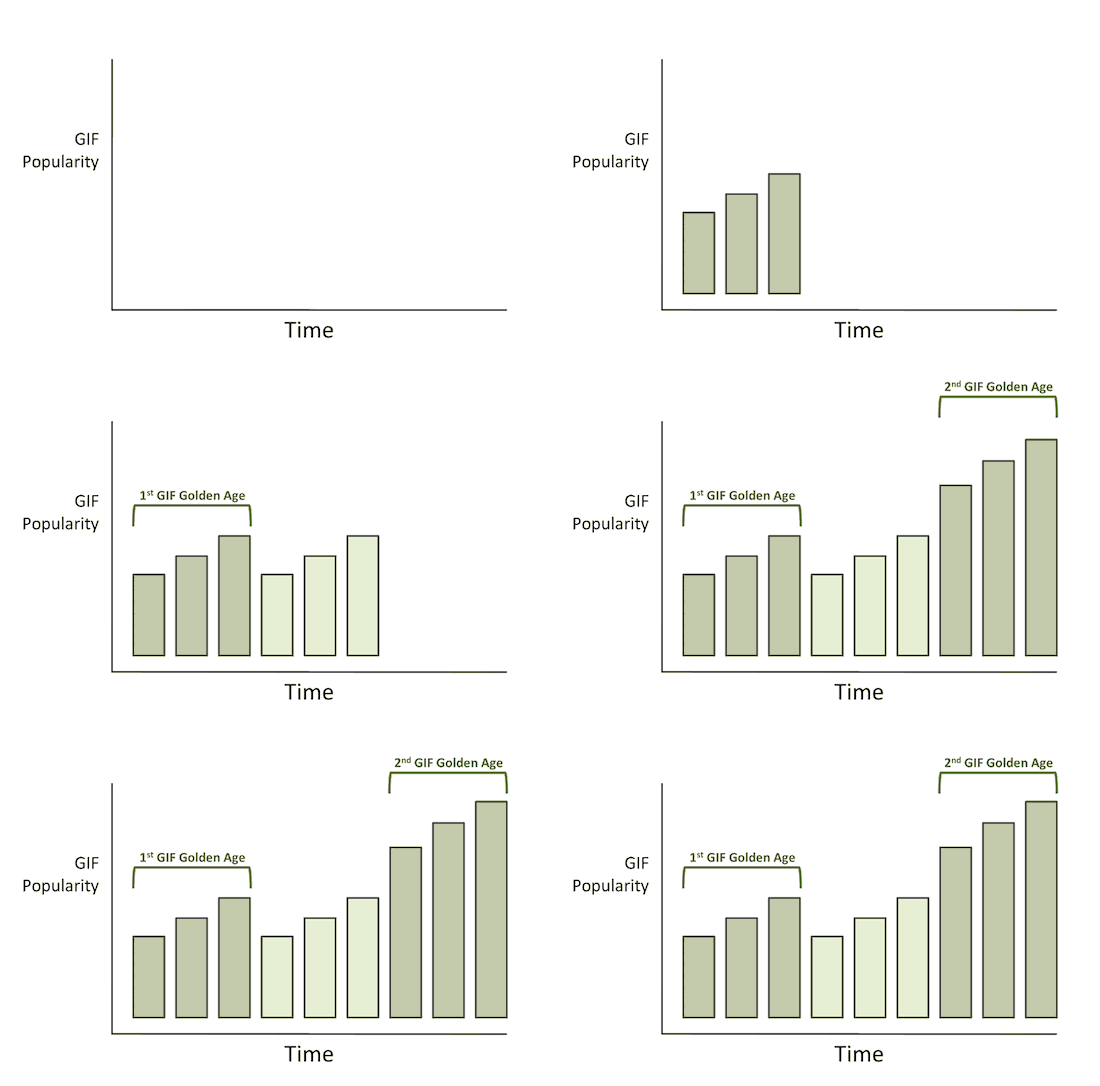
Bar Graph - Imagine every chart and graph coming together as an animated visual
poster image:

Image:

Guide Entry Text:
Landing Page Promo - Imagine using an animation to show product features, use cases, value propositions.
poster image:

Image:

Guide Entry Text:
Conversations and Interactions - Imagine a comic book-like experience as an animation
poster image:

Image:

Guide Entry Text:
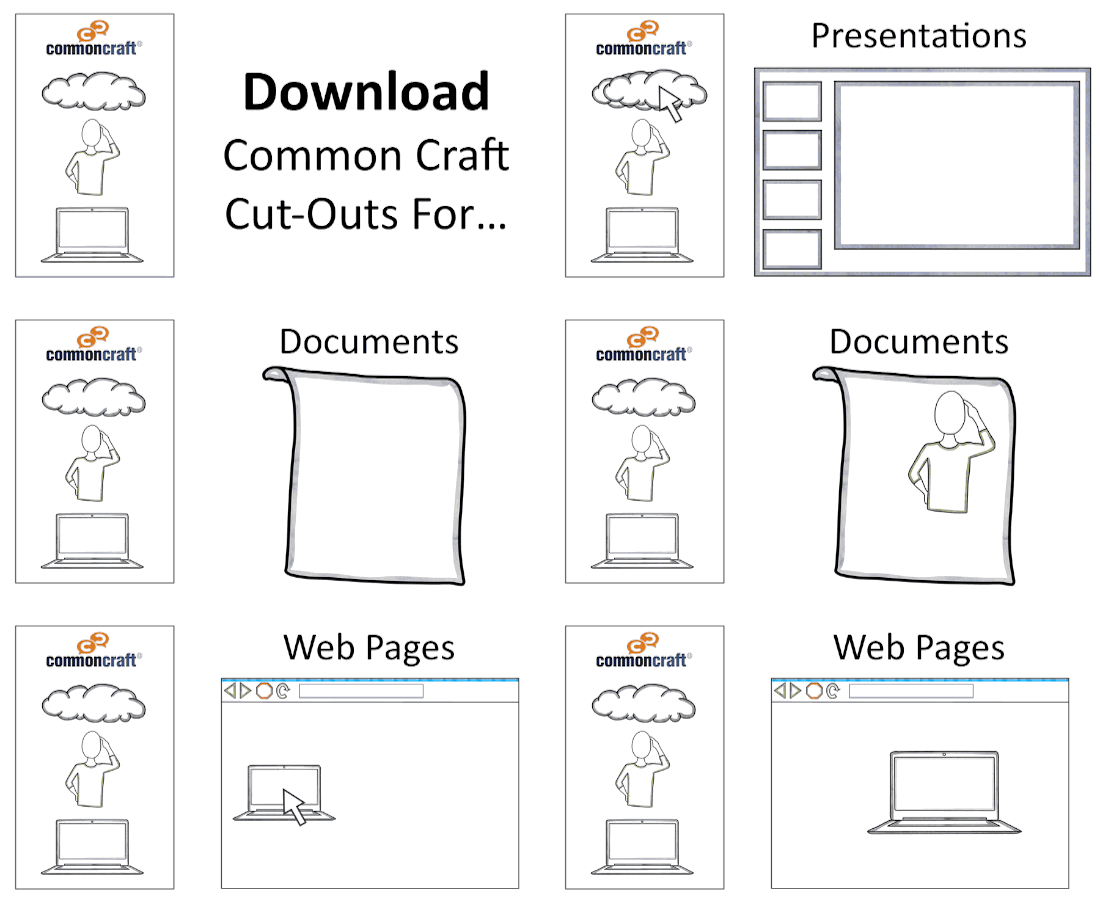
With a little practice, you'll be able to create similar animations with PowerPoint. I also use Common Craft Cut-outs for visuals.
To get you started, I'll focus on a very simple animation: the Venn Diagram. This simple version will allow us to focus on the skills and mechanics of creating animations rather than picking colors and words.
Here's an example that is like the one we'll create together:
poster image:

Guide Entry Text:
↵
Wait. Are these really better than static images?
It's a good question. A well-designed chart or graph can relate a lot of information without being animated. And in a lot of cases, a static image may be the best option. However, I think animated GIFs have inherent strengths that make them useful in a lot of cases.
- Movement attracts attention. A looping animated GIF attract the viewer's attention in a way that a static image cannot.
- When an animation loops, it can provide the viewer a way to digest the information more fully.
- Animations have the ability to pack a lot of visual information into a short, digestible package.
When do animations work best?
There are specific cases where animated GIFs can convey data or information much more effectively than static images. These are:
- When data change over time. Consider a GIF of deforestation of a rainforest.
- When simple becomes more complex. Imagine a GIF that shows individual molecules combining to create an element.
- When multiple steps are required in a process. Examples here include tying a bowtie, or completing an equation.
- Viewing multiple sides of a three-dimensional object. What does it look like from the back? Or the side?
- Analyzing a single object across multiple variables (time, size, color, etc.)
